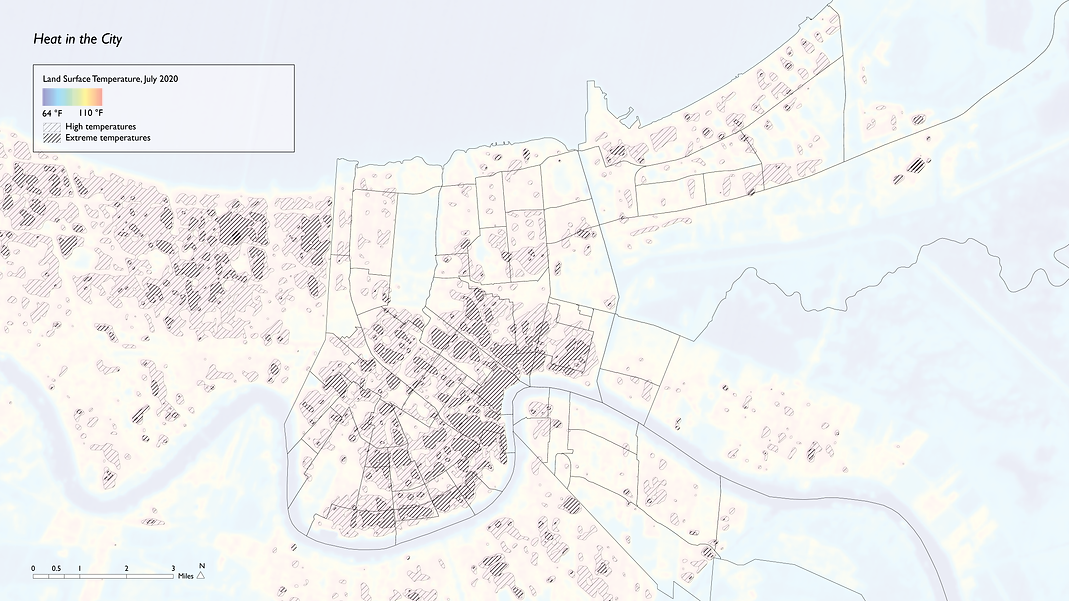
In New Orleans, there are typically around 112 days annually, about a third of the year, when the heat index exceeds 90 degrees Fahrenheit. During summer heat, the city can experience temperatures up to 16 degrees higher than nearby rural areas.
Heat is not felt uniformly but acts within an economic and health context which can be glimpsed through the layering of demographic data. To spatialize heat intolerance, this index considers 11 data points, including race, household composition, age, and housing cost burden.

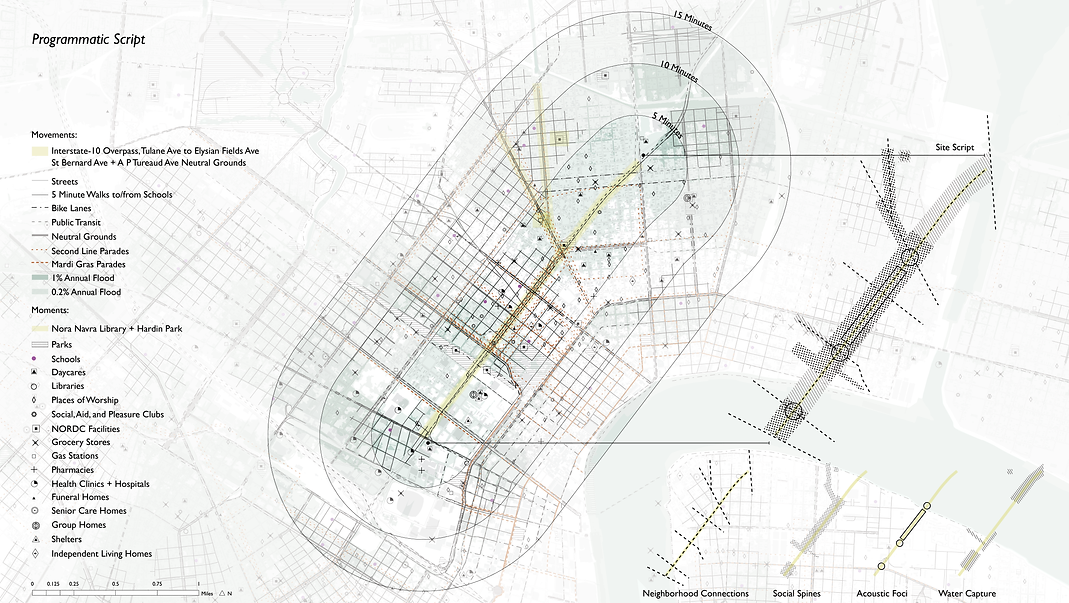
This project is sited in the Seventh Ward, a neighborhood that suffers from a confluence of heat and heat intolerance.

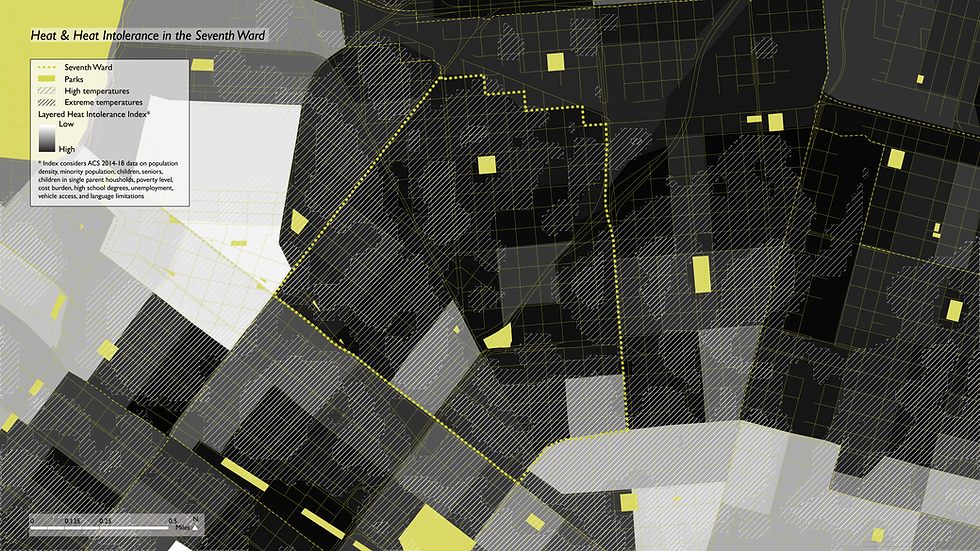
The temperature of the neighborhood is felt alongside the effects of pollution from I-10, flooding, and insufficient canopy and open space.

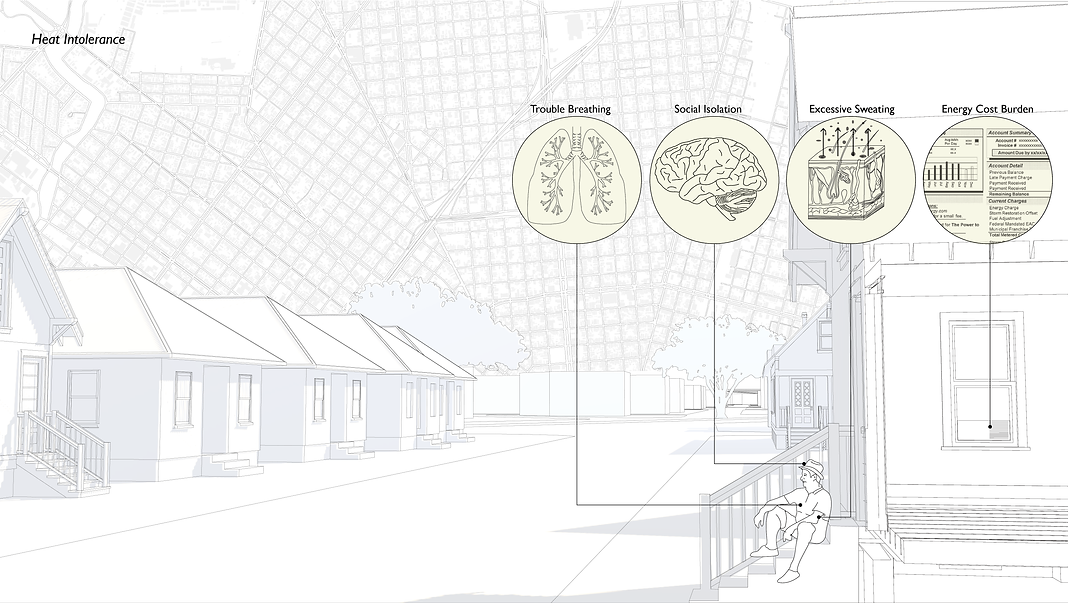
It is critical to continually center the individual’s experiences of comfort with radiation, evaporation, and air movement.

Heat disproportionately affects the elderly, the poor, and the isolated.
Design elements—both networked and acupunctural—are embedded within neighborhood nodes and flows to meet people where they are experiencing heat.

The design strategy is influenced by the flows and stops of the approximately 40 yearly second line parades. Second lines are held by Social, Aid and Pleasure Clubs. The routes and stops, the movements and moments, reflect spaces of memory in the neighborhoods—including sites of damage and desire.


The design focuses on two movements—the Claiborne Corridor and Interstate-10 swamp—and two moments—Nora Navra Library and Hardin Park.

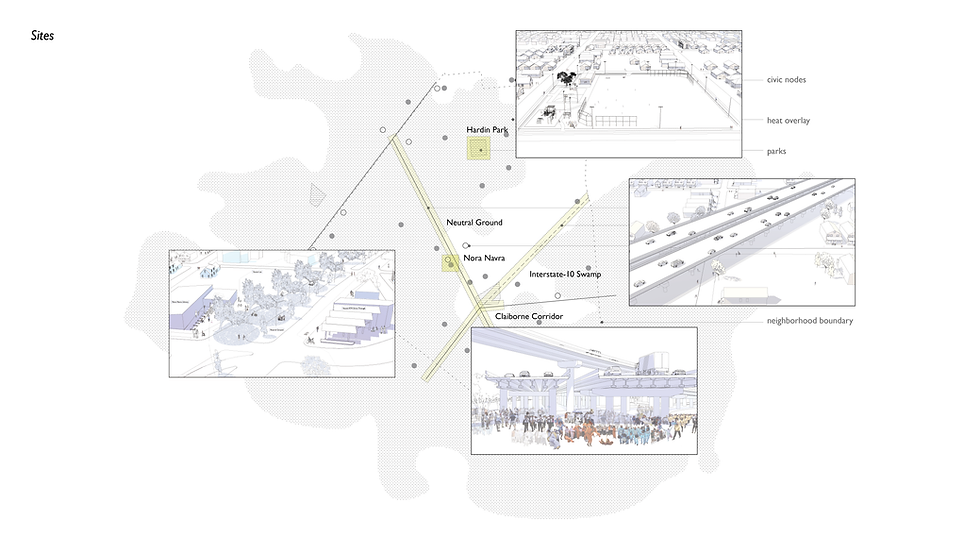
The sites exist within the larger system of movements and moments of the neighborhood and city—including walks to school, parades, flooding, places of worship, and home.
These four scores follow imagined daily movements and moments, and their interactions with thermal comfort.
